Complete Server Monitoring with NetCrunch
NetCrunch offers complete server monitoring providing comprehensive monitoring of hardware, virtualization, operating systems, containers, and application services.
NetCrunch provides complete server monitoring solutions for all layers regardless of which level of virtualization is implemented in your infrastructure. It can monitor hardware with IPMI, VMWare ESX hosts, Hyper-V hosts, all major operating systems, docker containers, and service applications running on top of it such mail server, file server, web server, or databases.
Beside typical performance and health monitoring, NetCrunch also covers complete server monitoring of alerts and logs (even text logs from applications).
Identify the root cause of the problem:- Complete server monitoring lets you control your infrastructure in real-time. Each layer of monitoring helps you in finding the cause of the failure or performance degradation. NetCrunch server monitoring not only checks the status and performance of each monitoring layer but also receives and reacts to events triggered by monitored systems.
Improve Performance & Stability:- The main goal of complete server monitoring is to maintain the system stability and uninterrupted operations. Server performance monitoring allows identifying early symptoms of performance degradation or failures. Complete server monitoring by NetCrunch can trigger automatic actions in response to received alerts or breached thresholds.
Plan and optimize accordingly:- Long-term server performance monitoring allows collecting data that can be used for analysis and planning. Thanks to complete server monitoring, you can easily identify trends, patterns, and anomalies. NetCrunch trend analyzer and built-in reporting help managers to plan expansion and optimization of their IT infrastructures.
Hardware Health Monitoring
The Intelligent Platform Management Interface (IPMI) is a set of computer interface specifications for an autonomous computer subsystem that provides management and monitoring capabilities independently of the host system’s CPU, firmware (BIOS or UEFI), and operating system. NetCrunch offers specialized monitors for IPMI monitoring.
Basic IPMI Sensor:- This sensor can monitor various hardware parameters such as system temperature, fan speed, power supply voltages, etc.
Generic IPMI Sensor:- This IPMI sensor can monitor all possible parameters received from the monitored device. A filter allows specifying the exact parameters to be monitored.
- IBM IMM IPMI:- This IPMI sensor is configured to monitor all essential metrics from an IBM IMM device.\
- HP iLO IPMI:- This IPMI sensor is configured to monitor all essential metrics from an HP iLO device.
- Dell iDRAC IPMI:- The sensor is configured to monitor all essential metrics from a Dell iDRAC device.
IPMI Log Sensor:- The IPMI Log sensor can retrieve logs from the System Event Log (SEL) which is a non-volatile repository for system events and certain system configuration information.
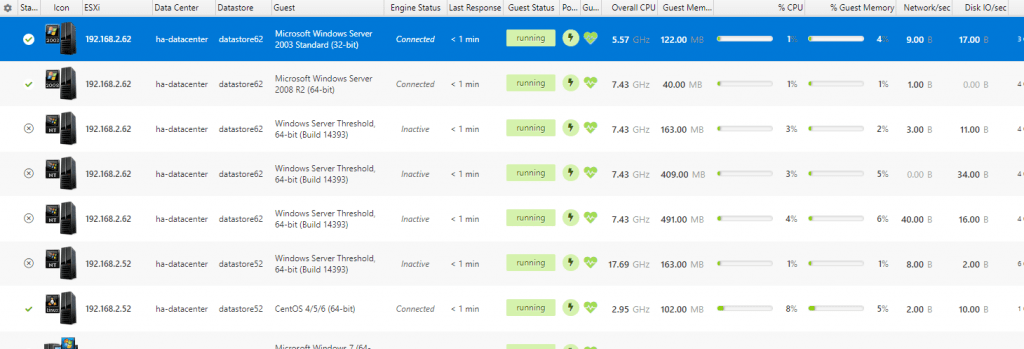
Virtualization Host Monitoring
NetCrunch complete server monitoring supports all ESX/i version 4 and later up to 6.7. It connects directly to the ESX servers, so it doesn’t need vSphere to be installed.
VMWare & Hyper-v Monitoring:- NetCrunch offers various views and ability to alert on performance metrics for both systems. We tried to provide similar monitoring capabilities for both systems.
Operating System Monitoring
NetCrunch monitors all major operating systems with no agents.
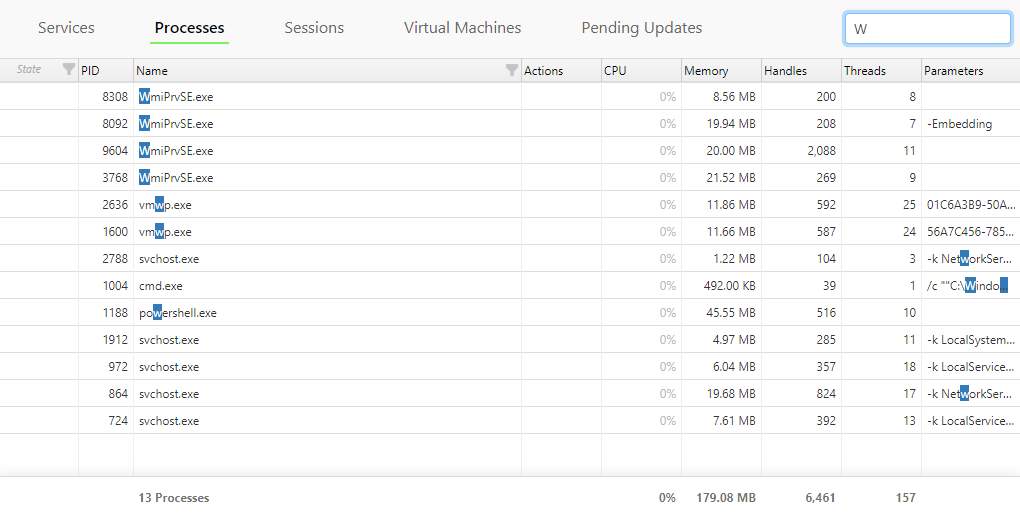
Windows:- NetCrunch complete server monitoring offers extensive monitoring for windows servers including
* Performance Monitoring, Custom WMI Monitoring, SQL Server Monitoring
* Event Log Monitoring, Hyper-V Monitoring, Process Monitoring
* AD Monitoring, Service Monitoring, Hardware & Software Inventory
Linux Monitoring:- NetCrunch monitors Linux without agents using an SSH script, which is automatically copied to a remote machine. Netcrunch includes monitoring packs for monitoring – CPU, Disk, SNMP, Memory, Network, Processes.
Other Unix family systems:- NetCrunch provides similar monitoring capabilities for other popular Unix family systems such as BSD, FreeBSD, OpenBSD, Mac OS X, Solaris, Monitoring IBM AIX, and AS/400.
Mail Server Monitoring
NetCrunch complete server monitoring allows various aspects of email monitoring.
Monitoring Mailbox – Mailbox Sensor allows for monitoring of mailbox authentication, activity, performance, and the size
Monitoring Emails – Data Email Sensor allows triggering alerts based on email sender, subject, or body. It can match emails using simple text patterns or by using parsing expressions (i.e. regular expressions, scripts).
Monitoring Mail Server – Email Round Trip Sensor is intended to check the mail server functionality by sending and receiving test emails. It must use a dedicated mailbox, and it removes test emails from the mailbox automatically.
File Server Monitoring
Folder Sensor:- Folder sensor allows observing folder content. The sensor can trigger alert when the file is deleted and on various other conditions.
File Sensor:- NetCrunch contains a single sensor that allows monitoring files using one of the five common protocols. You can monitor file size, file changes, accessibility or when it has been updated (file age).
Web Server Monitoring
Apache Server Monitoring:- NetCrunch allows monitoring performance of Apache web servers. The Apache sensor allows you to monitor various performance metrics grouped in objects like Country, Summary, and Virtual Host. As Apache is mostly used on Linux you can also use a standard Linux monitor to monitor the machine your Apache server is running on.
Monitoring IIS:- NetCrunch includes a monitoring pack for performance monitoring of the IIS web server. Additionally, you can use all windows performance monitoring power to control usage of vital systems resources such as memory or CPU.
Monitoring HTTP services:- Monitoring of web server wouldn’t be complete without checking the server service from the user perspective. NetCrunch includes several sensors for monitoring HTTP and web pages.
Web Page Sensor:- The sensor renders the page like a web browser, it loads all resources and runs scripts. It’s intended for monitoring modern pages or applications. It supports standard login and custom login forms.
Basic HTTP Sensor:- This sensor sends a single request and can alert on response code or by checking response data. It can send GET, HEAD, and POST requests. The sensor allows setting custom headers and cookies for the request.
REST HTTP:- Similar to the Basic HTTP sensor, this sensor also can send a single request and can alert on response code or by checking response data. Additionally, it can send any type HTTP request including a custom request and allows easily adding URL query parameters.
HTTP/s File Sensor:- Check remote file content, authentication parameters, monitor remote text logs, file size or change time, presence, and more.
Database Monitoring
SQL sensors allow measuring connectivity, query execution, and process result data as metrics or statuses. Supported databases include Oracle, SQL Server, PostgreSQL, MySQL, MariaDB, ODBC.
SQL Query:Object Sensor:- It allows executing a query returning a single row. It can be also used with an empty query just for checking database authentication and connectivity.
SQL Query:Data:- It allows executing a query returning multiple rows. Columns can be used as a source for metrics. The metrics enable triggering threshold alerts and can be used for reporting.
Monitoring Logs and Events
Monitoring of events is an essential part of the complete server monitoring process. Depending on the operating system or application NetCrunch collects events accordingly.
Windows:- NetCrunch can collect Windows event log events upon defined filtering rules using WMI.
Linux (Unix family systems):- NetCrunch can receive Syslog events.
SNMP:- For systems running SNMP, NetCrunch can receive traps and notifications.
Text Logs:- NetCrunch can parse text logs and comes with pre-defined parsers for Log4j and Apache log format. NetCrunch allows easily define custom parsers. NetCrunch can process logs remotely with an SSH connection.