Bandwidth Monitoring with NetCrunch
NetCrunch makes bandwidth monitoring a breeze. You can easily track and check bandwidth usage in your network with technologies such as SNMP, NetFlow, IPFix, sFlow, jFlow.
Bandwidth monitoring is a method of measuring the actual bandwidth available on the network system. Bandwidth monitoring tools can display real-time data such as download and upload speeds, and help counter the network stress. Depending on the devices used in the network you can shape the traffic by allocating separate bandwidth for the different traffic types. This requires more than just knowing the overall volume – you also need to know the traffic structure to plan accordingly.
Let NetCrunch work for you and discover its unbeatable configuration speed and monitoring performance. NetCrunch bandwidth monitoring can monitor as many as 35,000 switch interfaces from the single monitoring server.
Know who is hogging the bandwidth:- You probably know the situation when users are complaining about a slow network and you need to find the root of the problem fast. So, is it an application, a server, or a network? This is a question that is impossible to answer without proper insight into the network performance. NetCrunch gives you an excellent view of your network so you can easily determine which device should be blamed for the slowdown with a bandwidth analyzer.
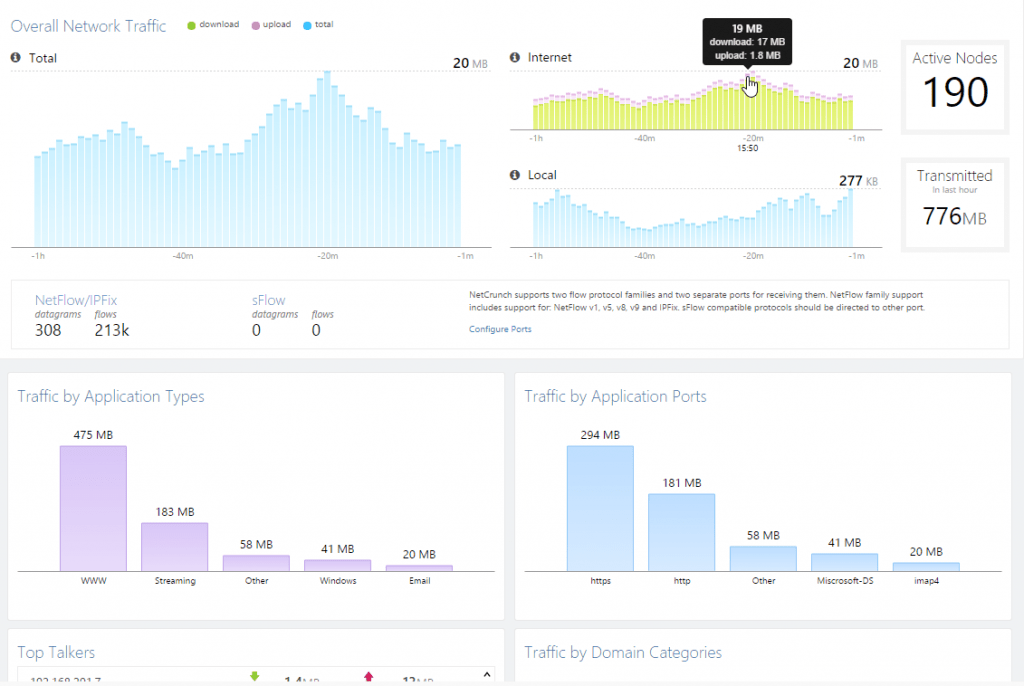
Practically check bandwidth usage:- Basic bandwidth monitoring starts with monitoring traffic on the switch ports. This method gives you a good overview of volume but little information about the traffic structure. To learn more, you can get an insight into the bandwidth analysis with technologies such as NetFlow, jFlow, sFlow, or NBAR, where routers are sending flow packets showing the bandwidth analyzer structure of the traffic which reflects bandwidth usage.
Bandwidth Monitoring
Bandwidth Monitoring with Traffic Flow Analytics
NetCrunch traffic analyzer processes flow data from Cisco and other devices supporting various protocols such as IPFix, NetFlow v5/ v9, jFlow, sFlow, netStream, cFlow, AppFlow, and rFlow.
NetCrunch supports NBARv2 application monitoring. For devices that do not include Cisco NBAR, you can create custom application definitions in NetCrunch Flow Analyzer.
Monitor Traffic with SNMP and RMON
NetCrunch includes a library of 8,700+ pre-compiled MIBs for many devices including switches, routers, and access points. With flexible NetCrunch MIB compiler, you can easily add another MIB, or – in case of any trouble – we will do it for you.
Monitoring Packs
RMON Traffic (SNMP):- Shows a collection of statistics per particular Ethernet interface on a device which can provide traffic data via RMON
Network Traffic (SNMP) (automatic):- Collects data for traffic statistics and Top Charts. It’s automatically assigned to appropriate devices. Thanks to NetCrunch policy-based management you can extend it or create a similar one for your specific devices.

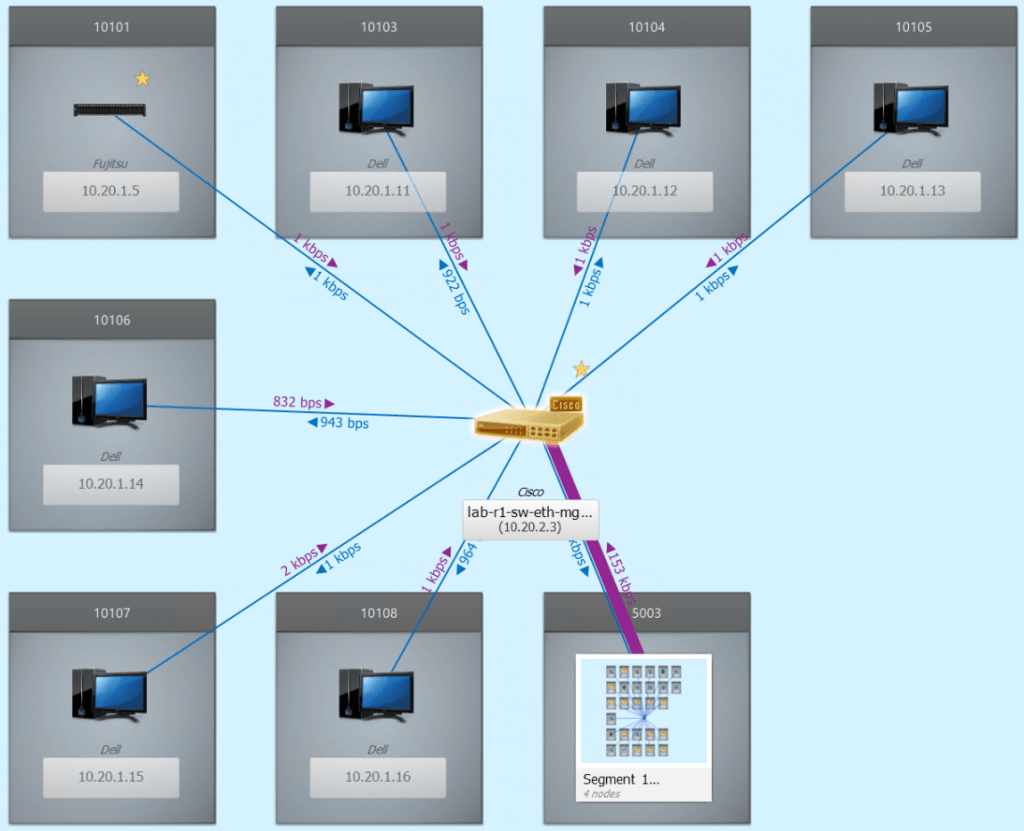
Layer 2 Mapping and Monitoring
NetCrunch presents layer 2 maps with the current traffic information.
NetCrunch can also visualize traffic volume on each port in the last 24 hours or in last hour.
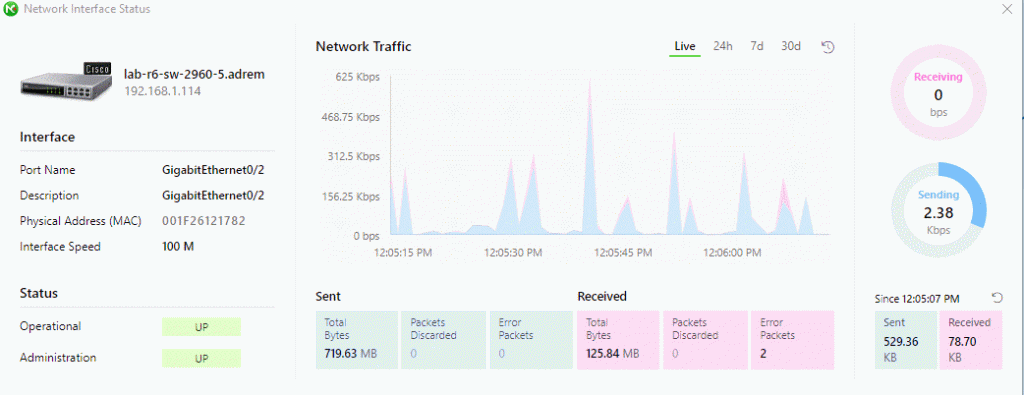
Live Port Traffic Monitoring
When clicking on a single switch connection located on the topology map, you can see real-time traffic on the selected connections.
You can also quickly switch between real-time view and last 24 hours, 7 or 30 days trend charts.
Monitoring Network Bandwidth on Servers
NetCrunch can monitor network utilization on all major operating systems such as
* Windows
* Linux
* BSD, FreeBSD, NetBSD
* Solaris
* Mac OS X
It can monitor such parameters as
* Total traffic on the network card
* Number of received and sent packets
* Number of discards, errors, unicast packets, and unknown protocols
NetCrunch automatically does bandwidth monitoring on servers and switches, so the necessary charts are waiting for you. Top charts aggregate data for any group of devices defined in the Atlas, and many of the groups (basically created by filtering condition) that NetCrunch creates automatically.
Top charts include – Network Traffic (Switches and Routers) – Top Interfaces by Traffic – Network Traffic (Servers)